Demographic change
In the following table you will see how the
(Note: enter the time horizon 2050 into the user instructions).
| Period | 2016-2020 | 2021-2025 | 2026-2030 | 2031-2035 | 2036-2040 | 2041-2045 | 2046-2050 |
|---|---|---|---|---|---|---|---|
| Ø* number of children per woman | 1.52 | 1.55 | 1.55 | 1.6 | 1.6 | 1.6 | 1,6 |
| Ø male life expectancy | 81.5 | 83.0 | 84.0 | 85.0 | 85.5 | 86.5 | 87,0 |
| Ø female life expectancy | 85.3 | 86.0 | 87.0 | 87.5 | 88.0 | 89.0 | 89,5 |
| Ø annual net migration | 50,799 | 50,000 | 55,000 | 50,000 | 40,000 | 35,000 | 35 000 |
*Ø = average
Decide in the following table whether the particular influencing factor has risen (+), stayed the same (0) or fallen (–).
| Period | 2021-2025 | 2026-2030 | 2031-2035 | 2036-2040 | 2041-2045 | 2046-2050 |
|---|---|---|---|---|---|---|
| Ø number of children per woman | ||||||
| Ø male life expectancy | ||||||
| Ø female life expectancy | ||||||
| Ø annual net migration |
Select 2020 as the population pyramid year. Study the chart. The light green bars show the number of men of a particular age (the age is specified in the middle), the dark green the number of women. The wider the pyramid at a particular age, the more people there are of this age.
How many men aged 80–84 are there in 2020 (move the mouse cursor over the green bar to read the value)? How many women aged 80–84 are there in 2020?
Now set the population pyramid year and the year for the charts on the left to 2050.
How many men aged 80–84 do you see now? How many women?
Calculate the difference in the values for 2020 and 2050. Compare this difference with the value in 2020. What do you see?
How does the total population figure change between 2020 and 2050? Calculate the difference between the population figure for 2020 and that for 2050.
Look at the chart on the old-age dependency ratio. How will it change between 2020 and 2050 according to the scenario? Calculate the difference. What does this change mean for pensions?
Bear in mind that the old-age dependency ratio is the ratio of pensioners to people of working age. An old-age dependency ratio of 33 means that one person of working age has to cover 33% of an individual’s OASI pension. In this example there are three people of working age for every one female pensioner (see table in Task 1 of Worksheet 1).
Enter the values from the following table. Only net migration has changed.
| Period | 2016-2020 | 2021-2025 | 2026-2030 | 2031-2035 | 2036-2040 | 2041-2045 | 2046-2050 |
|---|---|---|---|---|---|---|---|
| Ø number of children per woman | 1.52 | 1.55 | 1.55 | 1.6 | 1.6 | 1.6 | 1,6 |
| Ø male life expectancy | 81.5 | 83.0 | 84.0 | 85.0 | 85.5 | 86.5 | 87,0 |
| Ø female life expectancy | 85.3 | 86.0 | 87.0 | 87.5 | 88.0 | 89.0 | 89,5 |
| Ø annual net migration | 50,799 | 75,000 | 75,000 | 75,000 | 75,000 | 75,000 | 75 000 |
What is the old-age dependency ratio in 2050?
Calculate the difference in the old-age dependency values between 2020 and 2050.
Now enter 30,000 as the average annual net migration for every year.
What is the old-age dependency ratio in 2050 now?
Now enter 100,000 as the average annual net migration for every year.
What is the old-age dependency ratio in 2050?
Compare the population figure in 2050 for question 2c with that for 1e.
Calculate the difference.
What impact does higher net migration have on the old-age dependency ratio?
How does higher net migration affect pension funding?
What impact does higher net migration have on the total population figure?
What effects does this development have?
Optional: Think of your own scenario for future demographic trends and enter these values into the simulation.
Compare the data for Finland and Switzerland in the following table.
| Ø number of children per woman |
Ø male and female life expectancy |
Ø annual net migration (per 1,000 inhabitants) |
Old-age dependency ratio | |
|---|---|---|---|---|
| Switzerland 2020 | 1.46 | 83.0 | 6.2 | 30.3 |
| Finland 2020 | 1.37 | 82.0 | 3.2 | 36.0 |
Data: Eurostat and SFSO, 2020
What differences do you see?
Tick the appropriate boxes.
Look at the population pyramids for Switzerland shown below.
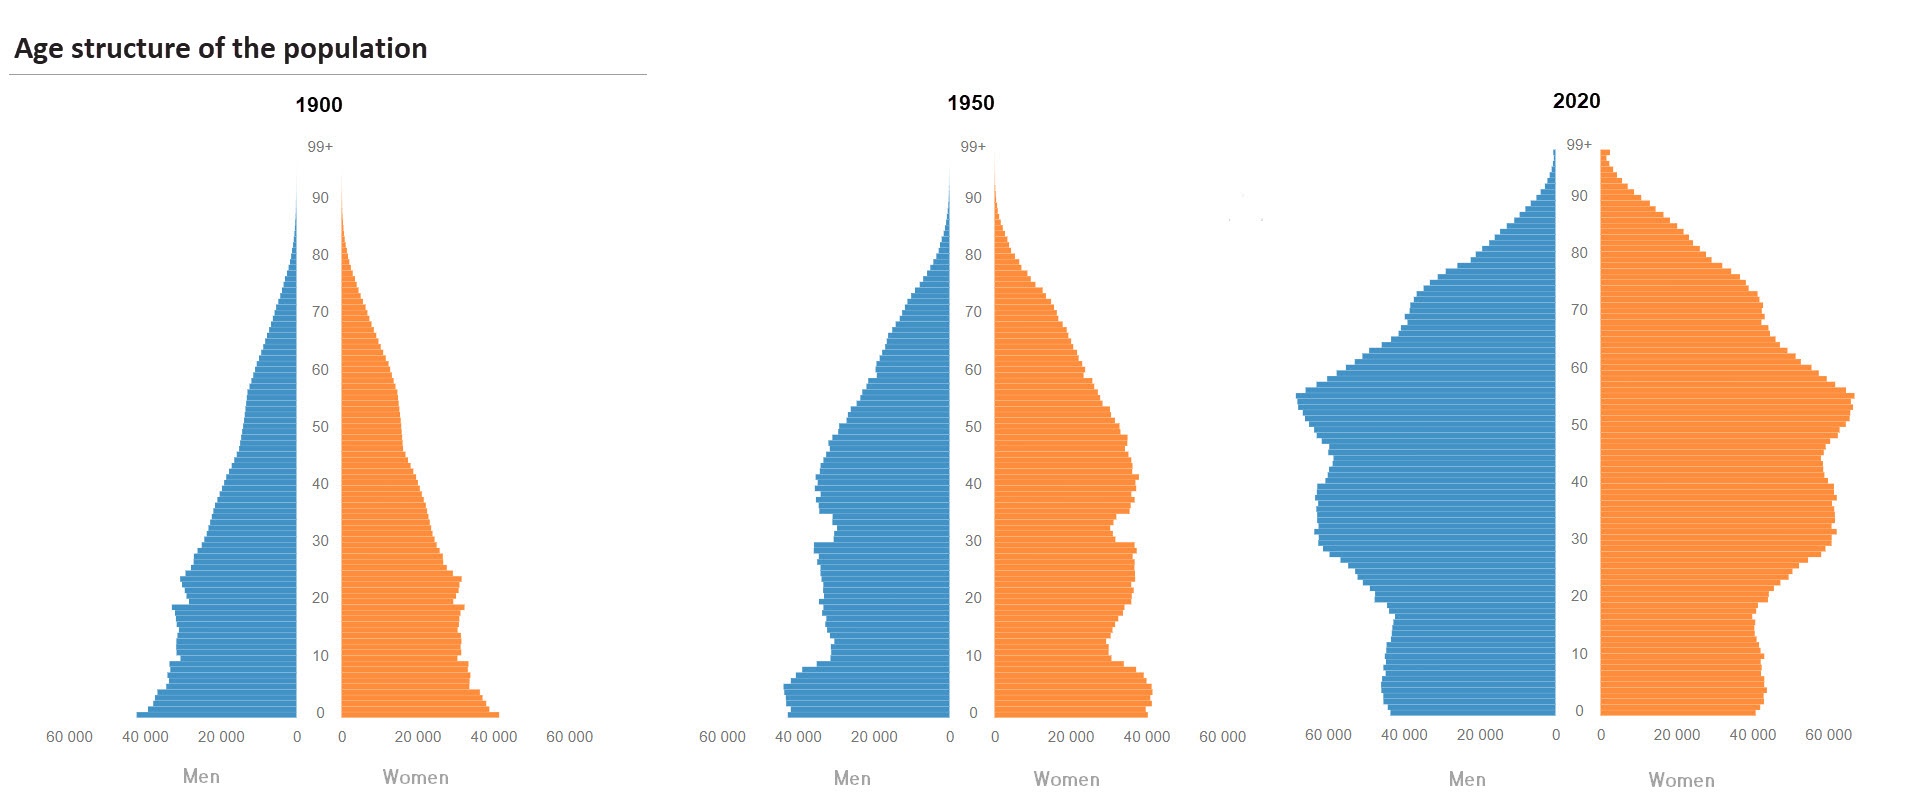
Source(s): SFSO – VZ, STATPOP, © SFSO, Neuchâtel 2021
Compare the shape of the three pyramids. Which age category is the biggest in each one?
What strikes you about the shape of the three pyramids in general?
How is the population distributed over the different age groups?
How has total population developed?
Compare the population pyramid of Burkina Faso with that of Switzerland. Burkina Faso is a country in West Africa with a population of approximately 19 million. It is one of the poorest countries in the world. Approximately one third of the population has to survive on
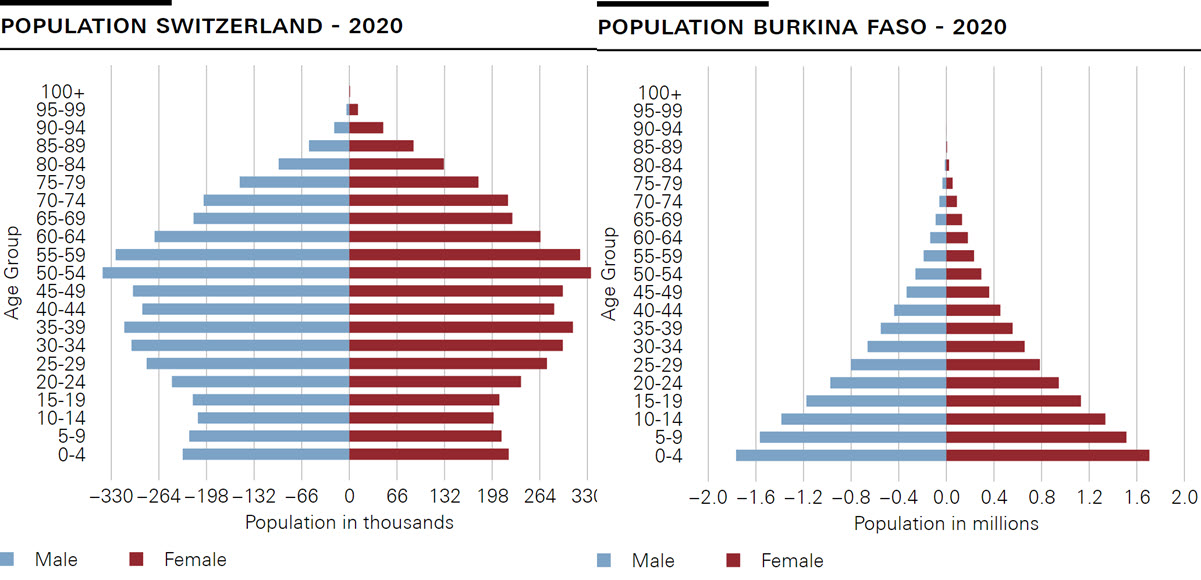
Quelle: UNO, World Population Prospects 2022
Which age category is the largest in each case?
Why does Burkina Faso’s pyramid differ so strongly from Switzerland’s?
Think about the following factors: average number of children per woman, life expectancy, migration.
Like any model, the web simulation of Switzerland’s population growth has certain advantages and disadvantages. The following is an excerpt from slide 20 of the presentation on ‘Switzerland’s ageing population’ (Raymon Kohli, Swiss Federal Statistical Office (SFSO)). The excerpt contains a list of the advantages and disadvantages of the web simulation compared with the SFSO model used to predict population trends in Switzerland.
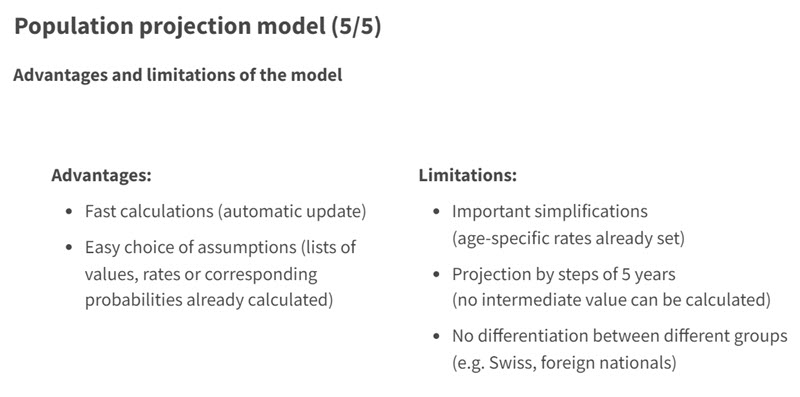
Put these advantages and disadvantages into context and evaluate the web simulation of Switzerland’s population growth.
Any model is a simplified representation of reality. It therefore does not represent the complete world, but a section of it. How large this section is depends on the purpose for which the model is to be used (analogous to a map). By omitting unimportant parts of reality, models bring the represented facts into a manageable form.
Some models, such as the SFSO model, can be used for forecasting purposes. This means that with the help of the SFSO model, statements can be made about the future development of the population. However, the predictive power of even the best population forecasting model is limited. Why? Give arguments.
